Moving Beyond Activity Counts: Better Leading Indicators with MākuSafe
August 20, 2025

Why It’s Time to Rethink Safety KPIs
For years, safety professionals have worked to identify the right leading indicators – measures that provide early warning of risk and reflect the health of a safety program. Yet, many organizations still rely on metrics like the number of safety meetings held, training sessions delivered, or observations submitted. While these show activity, they often fail to demonstrate whether the right hazards are being identified, whether leadership is engaged, or whether corrective actions are actually being taken.
National Safety Council, Campbell Institute, and OSHA guidance all emphasize the same point: the best leading indicators are proactive, preventive, and predictive. They are actionable, timely, and give leaders meaningful insights into how effectively risks are being managed.
Stronger Leading Indicators
| Traditional / Weaker Indicators | MākuSafe Data-Driven Indicators |
| Number of safety meetings held | Worker engagement measured through wearable checkouts and consistent use |
| Attendance at training sessions | Leader “Taking Action” by creating and completing corrective actions in MākuSmart |
| Count of observations submitted | Quality and timeliness of MyVoice reports from frontline workers leading to hazard resolution |
| Volume of safety audits performed | Environmental data trends (heat, humidity, noise, air quality) that reveal real exposure and risk |
| Safety committee meetings | Physicality data highlighting high strain/exertion, prompting process changes to prevent MSDs |
Instead of measuring inputs or participation alone, MākuSafe provides evidence-based, real-time leading indicators that reflect how proactively hazards are being identified and addressed.
The Engagement Index: A True Barometer of Safety Health
From the first day of deployment, MākuSafe’s analytics platform, MākuSmart, delivers meaningful leading indicators through its Engagement Index (EI). This score provides a dynamic measure of safety culture and program health at each site, weighted equally across four components (25% each):
- Wearable device usage/checkouts – Are frontline workers actively engaged with the Ally wearable?
- MyVoice reporting – Are workers sharing real observations, concerns, and ideas?
- Leader platform use – Are safety leaders engaging with the data, trends, and reports?
- Taking Action – Are hazards and risks being converted into corrective actions, tasks, and closed workflows?
With EI scores rolling up to the corporate level, executives can see how sites compare and quickly identify where engagement is thriving and where additional support is needed. Some client sites have even reached a perfect 100% EI – a sign of a truly engaged workforce and leadership team.
All MākuSafe Data = Leading Indicators
Every data stream captured by the MākuSafe Ally wearable has predictive value and drives prevention:
- High physicality readings → prompt observation of work tasks, leading to process redesign and elimination of strain and exertion risks.
- Elevated heat and humidity trends → enable intervention before heat stress incidents occur.
- Poor indoor air quality readings → point to harmful compounds or process changes that may compromise worker health.
- Meaningful MyVoice reports → capture frontline concerns that otherwise go unreported, often surfacing hazards hidden from management.
- Noise level exposure trends → highlight areas where controls are needed to prevent long-term hearing damage.
This continuous flow of meaningful, contextual data empowers safety teams to act before incidents occur, not after.
Client Results: Proving the Impact
Injury & Incident Reduction
- FleetPride: With best-in-class Engagement Index scores across all sites, FleetPride achieved its lowest workers’ comp incident rate in 12 years, demonstrating how engagement translates directly into outcomes.
- NFI Industries: By monitoring worker movement and physicality, NFI significantly reduced musculoskeletal injuries and gained insight that helped reengineer high-risk tasks.
- Warehousing & Distribution: Multiple sites achieved zero injuries for extended periods by proactively preventing overexertion and MSDs with physicality monitoring.
Environmental & Worker Health
- Fratco: Real-time environmental data highlighted issues with heat and air quality, leading to corrective actions that reduced risk in production areas.
- Remote Workers: The Remote Worker™ app gave organizations visibility into exposures faced by drivers and field staff, enabling proactive interventions beyond the facility.
Forklift & Pedestrian Safety
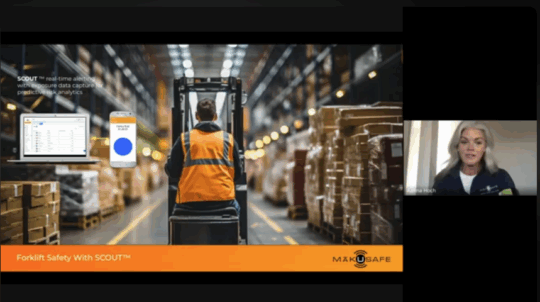
- Scout Forklift Safety: One logistics client reduced forklift–pedestrian interactions by 86% in six months using Scout, while maintaining productivity and reengineering workflows to eliminate risk.
Productivity & ROI
- Fatigue Reduction: Physicality monitoring helped workers manage fatigue across shifts and weeks, leading to average productivity gains of 6% – over $700,000 in annual labor savings per site, delivering significant ROI.
Engagement & Participation
- Frontline Voice in Action: Some client sites collect hundreds of MyVoice reports each month from frontline workers. Many of these reports surface significant hazards or opportunities, which are converted into corrective actions and tracked for mitigation, creating a continuous improvement cycle.
- Improved Culture & Satisfaction: Clients who regularly use climate and satisfaction surveys report higher scores tied to worker engagement, crediting the push-to-talk MyVoice feature for giving employees a meaningful way to be heard and actively shaping safer workplaces.
These results underscore the power of data-driven leading indicators to drive safer operations, stronger cultures, and measurable ROI.
Why It Matters
Better leading indicators aren’t just about compliance – they’re about building resilient, proactive safety cultures. When safety leaders can measure engagement, action, and real exposures, they gain confidence that risks are being managed effectively, not just discussed.
As OSHA highlights, the best leading indicators are SMART: Specific, Measurable, Accountable, Reasonable, and Timely. MākuSafe’s data fits every one of these criteria, making it one of the most meaningful ways to gauge safety program health and predict future performance.
Take the Next Step
If you’re still tracking meetings and sign-in sheets, it’s time to move beyond activity counts. With MākuSafe, you can start collecting actionable, meaningful data within days, not months.
Talk to our team today. Request a demo, explore what a pilot entails, and see how swiftly you can begin driving proactive safety outcomes!


